This page shows how many people visit the pages of Gustave Doré on this website. A visit means one person opened a page. Each chart below has its own short explanation.
!
Statistics were reset on 1 July 2026 — no data is available before that date.
Gustave Doré: what a year of visits shows
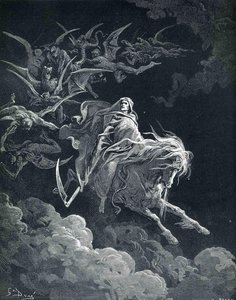
The Valley of Tears is the work most watched: 2,200 visits in a year, 1% of all the attention paid to Gustave Doré. It is followed by The Vision of Death and The Fall Of The Rebel Angels. The artist page received 12,600 visits and the works 181,800: 194,400 in total. Attention is up 87% from Aug 2026 to Sep 2026. Jul 2026 was the busiest month, with 153,500 visits. Visitors read in English (32%), Spanish (12%) and Russian (9%). Visitors come from United States of America (13%), Bulgaria (8%) and Spain (8%). Visitors watch on computers (90%), phones (9%) and tablets (1%). They favour Earthy (Color Palette): 26% of visits against 15% of the catalog.
The 10 most watched works of Gustave Doré
Each rank reflects the visits received on OriginalUniqueArt.com during the last twelve months; rank 1 is the most visited work of Gustave Doré.
Each bar is one month. It shows how many times people opened the page of this artist during that month, over the last twelve months.
The data in a table
Month
Artist page
Artwork pages
Oct 2025
0
0
Nov 2025
0
0
Dec 2025
0
0
Jan 2026
0
0
Feb 2026
0
0
Mar 2026
0
0
Apr 2026
0
0
May 2026
0
0
Jun 2026
300
10,200
Jul 2026
4,600
148,900
Aug 2026
1,600
9,000
Sep 2026
6,100
13,700
When are the works of Gustave Doré opened?
Each bar is one month. It counts the visits to all the artwork pages of this artist added together, month by month, for one year.
The monthly figures of both charts are in the first table, above.
What do visitors choose among the works of Gustave Doré?
Each star chart compares two things. The dotted shape is the artist's own work: fifty artworks taken at random, sorted by one feature. The solid shape is where the visits actually went during the last twelve months. Where the solid shape reaches further out than the dotted one, that kind of artwork attracts more attention than its share of the artist's work.
Vibe
Emotional Tone
Luminance
Color Saturation
Color Palette
Color Intensity
Contrast
Color Harmony
The data in a table
Vibe
Vibe
Artworks of the artist
Visits
Dramatic
87.5%
83.2%
Romantic
0.0%
10.7%
Ethereal
8.3%
1.7%
Elegant
0.0%
1.6%
Calm
0.0%
0.9%
Serene
0.0%
0.8%
Nostalgic
0.0%
0.6%
Whimsical
0.0%
0.3%
Emotional Tone
Emotional Tone
Artworks of the artist
Visits
Melancholic
66.7%
77.5%
Dramatic
8.3%
7.5%
Mysterious
12.5%
6.6%
Somber
0.0%
2.3%
Spiritual
8.3%
2.1%
Powerful
0.0%
1.1%
Nostalgic
0.0%
1.0%
Reflective
4.2%
0.6%
Luminance
Luminance
Artworks of the artist
Visits
Dark
20.0%
20.1%
Soft Shadow
14.0%
20.2%
Gentle Luminance
40.0%
37.9%
Bright Balance
24.0%
18.2%
Luminous
2.0%
3.6%
Color Saturation
Color Saturation
Artworks of the artist
Visits
Muted
90.0%
94.3%
Subtle Color
6.0%
3.8%
Balanced Soft
2.0%
1.0%
Clear Color Presence
0.0%
0.8%
Vivid Color
2.0%
0.1%
Color Palette
Color Palette
Artworks of the artist
Visits
Neutrals
75.0%
70.3%
Earthy
15.0%
25.9%
Dark
5.0%
1.8%
Monochrome
5.0%
1.4%
Pastels
0.0%
0.5%
Color Intensity
Color Intensity
Artworks of the artist
Visits
Monochromatic
90.0%
93.5%
Balanced
8.0%
5.9%
Vivid
2.0%
0.6%
Contrast
Contrast
Artworks of the artist
Visits
Serene
2.0%
5.0%
Gentle
32.0%
20.6%
Balanced
20.0%
15.8%
Bold
20.0%
23.0%
Statement
26.0%
35.6%
Color Harmony
Color Harmony
Artworks of the artist
Visits
Discordant Palette
10.0%
7.9%
Softly Mixed Palette
2.0%
5.9%
Balanced Harmony
8.0%
3.5%
Strong Color Unity
14.0%
17.1%
Unified Palette
66.0%
65.6%
What are the most watched works of Gustave Doré, month by month?
Each row is one popular artwork. Each bar shows how many visits that artwork received in one month. Taller bars mean more visits that month.
The data in a table
Artwork
Oct 2025
Nov 2025
Dec 2025
Jan 2026
Feb 2026
Mar 2026
Apr 2026
May 2026
Jun 2026
Jul 2026
Aug 2026
Sep 2026
The Acrobats
0
0
0
0
0
0
0
0
0
500
300
100
The Christian Martyrs
0
0
0
0
0
0
0
0
0
700
0
200
The Inferno, Canto 9, lines…
0
0
0
0
0
0
0
0
0
400
0
500
Paradise Lost
0
0
0
0
0
0
0
0
0
500
0
300
Gd 0001 Red Riding Hood mee…
0
0
0
0
0
0
0
0
0
0
0
0
The Inferno, Canto 22, line…
0
0
0
0
0
0
0
0
0
200
0
100
Souvenir of Loch Lomond
0
0
0
0
0
0
0
0
0
500
100
300
Satan's Flight Through Chaos
0
0
0
0
0
0
0
0
0
0
0
100
The Valley of Tears
0
0
0
0
0
0
0
0
0
1,600
200
200
Dante and Pope Adrian V
0
0
0
0
0
0
0
0
0
500
200
0
What is the device split of the Gustave Doré audience?
Each slice is one kind of device: phone, tablet or computer. The bigger the slice, the more visits came from that kind of device during the last twelve months.
The data in a table
Device
Visits
Share
computers
175,400
90.2%
phones
17,000
8.7%
tablets
2,000
1.0%
In what languages is Gustave Doré followed?
Each slice is one language. The bigger the slice, the more visitors used the website in that language during the last thirty days. Only the top ten are shown.
The data in a table
Language
Visits
Share
English
2,600
32.5%
Spanish
1,000
12.5%
Russian
700
8.8%
Bulgarian
500
6.2%
French
400
5.0%
Korean
400
5.0%
Italian
300
3.8%
Japanese
300
3.8%
Dutch
300
3.8%
Arabic
200
2.5%
How many visits per day does Gustave Doré get, and what next?
Each bar is one day. The first bars count the visits of the past three weeks. The bars in the second color are our guess for the next three weeks.
The data in a table
Day
Visits
Mon 5 Oct
1,300
Tue 6 Oct
1,000
Wed 7 Oct
1,200
Thu 8 Oct
1,500
Fri 9 Oct
700
Sat 10 Oct
1,100
Sun 11 Oct
2,500
Mon 12 Oct
2,400
Tue 13 Oct
1,800
Wed 14 Oct
1,300
Thu 15 Oct
1,600
Fri 16 Oct
1,300
Sat 17 Oct
1,600
Sun 18 Oct
2,300
Mon 19 Oct
3,200
Tue 20 Oct
2,800
Wed 21 Oct
2,700
Thu 22 Oct
3,500
Fri 23 Oct
2,500
Sat 24 Oct
3,000
Sun 25 Oct
1,900
Mon 26 Oct (forecast)
4,000
Tue 27 Oct (forecast)
3,300
Wed 28 Oct (forecast)
3,000
Thu 29 Oct (forecast)
3,800
Fri 30 Oct (forecast)
2,600
Sat 31 Oct (forecast)
3,300
Sun 1 Nov (forecast)
3,900
Mon 2 Nov (forecast)
4,600
Tue 3 Nov (forecast)
3,800
Wed 4 Nov (forecast)
3,500
Thu 5 Nov (forecast)
4,400
Fri 6 Nov (forecast)
3,000
Sat 7 Nov (forecast)
3,800
Sun 8 Nov (forecast)
4,500
Mon 9 Nov (forecast)
5,200
Tue 10 Nov (forecast)
4,200
Wed 11 Nov (forecast)
3,900
Thu 12 Nov (forecast)
4,900
Fri 13 Nov (forecast)
3,400
Sat 14 Nov (forecast)
4,300
Sun 15 Nov (forecast)
5,000
What people ask about Gustave Doré
Which work of Gustave Doré is the most visited?
The Valley of Tears first, with 2,200 visits, 1% of the views. 10 works are ranked above.
How large is the audience of Gustave Doré on OriginalUniqueArt.com?
194,400 visits in twelve months: 12,600 to the artist page, 181,800 to the works.
What devices bring the audience of Gustave Doré?
The audience comes from computers (90%), phones (9%) and tablets (1%); computers bring 90% of the visits.
Which languages do the followers of Gustave Doré use?
English (32%), Spanish (12%) and Russian (9%); English covers 32%.
Which works of Gustave Doré match the taste of visitors?
Works described as Earthy (Color Palette) get 26% of the visits for 15% of the catalog.
 1
The Valley of Tears
2,200 visits · 1.1%
 2
The Vision of Death, 1868
2,200 visits · 1.1%
 3
The Fall Of The Rebel Angels
2,000 visits · 1.0%
 4
Paolo and Francesca II
1,900 visits · 1.0%
 5
dore gustave - (66)
1,300 visits · 0.7%
 6
The Avaricious
1,200 visits · 0.6%
 7
The Christian Martyrs
1,100 visits · 0.6%
 8
The Inferno, Canto 9, lines 87-89. To the gate He came, and with his wand touch’d it, whereat Open without impediment it flew.
1,100 visits · 0.6%
 9
The Angel Is Sent to Deliver Israel
1,100 visits · 0.6%
 10
The Vision Of Death
1,100 visits · 0.6%